Working with Congressional Data
By Josh McCrain
 Twitter
1 Introduction
This section of the guide will go over how to work with congressional data, including merging by shared IDs, cleaning data, and creating new measures from publicly-available data. From a practical perspective, I’ll also show to to accomplish a suprisingly counter-intuitive task: dealing with committee assignments.
While I will discuss each operation in some detail, it would be helpful to have a working knowledge of the R syntax and the tidyverse framework. An excellent resource is in the free R for Data Science book by Hadley Wickham.
2 Merging data by shared IDs
In the best case scenario, you will be working with cleaned datasets by professional academics, data scientists, or data providers that use common unique IDs. I would say 75% of my work uses such data. However, that other 25% – the use of data that is messy – will take up most of your actual time. I’ll go over how to use these types of data at the end of this guide.
First, let’s look at two very useful datasets which do share common IDs: The Stewart and Woon: Congressional Committee Assignments Data and the Historical Congressional Legislation and District Demographics. Go to each website and download the data (and the codebook for reference). The Committee and Member assignment data is straightforward. However, if you’ve never worked with dataverse before it may be intimidating. Simply find the file “allCognressDataPublishV2.tab”, go to the “Download” dropdown adjacent to it, and click “Original File Format.”
2.1 Reading in the data
Now, let’s set up the workspace and read the data in. This is fairly straightforward given the file types of what we just downloaded.
# install.packages("tidyverse") # install first
library(tidyverse)
# install.packages("readxl")
library(readxl)

setwd("J:/Dropbox/Dropbox/R for Congress") # customize based on your own computer

cong_data <- read_csv("data/allCongressDataPublishV2.csv")

sw_cmte <- read_excel("data/house_assignments_103-115-3.xls")

sw_mems <- read_excel("data/house_members_103-115-2.xlsx")
You can take a look at each of these dataframes in the Environment pane of the RStudio IDE. They all look good except the last, sw_cmte, which has incorrect column names.
## # A tibble: 6 x 13
##   `Data set date:~ ...2  ...3  ...4  ...5  ...6  ...7  ...8  ...9  ...10
##   <chr>            <chr> <chr> <chr> <chr> <chr> <chr> <chr> <chr> <chr>
## 1 cong             offi~ id    name  dist~ stat~ stat~ part~ part~ ch_s~
## 2 103              3     1077  Broo~ 9     TX    49    D     100   21
## 3 103              3     2605  Ding~ 16    MI    23    D     100   20
## 4 103              3     6455  Mich~ 18    IL    21    R     200   19
## 5 103              3     6845  Natc~ 2     KY    51    D     100   21
## 6 103              3     8080  Rost~ 5     IL    21    D     100   18
## # ... with 3 more variables: ...11 <chr>, ...12 <chr>, ...13 <chr>
It looks like the column names are in the second row, so let’s add in one of the options to the read_excel function to fix that for us:
The sw_mems dataset is a great starting point since it’s a simple member-level dataset with terms served, congress, an icpsr ID, and district names. It also tells us in the chamber status and Notes column what happens to the member during the next Congress.
Our first step is to merge in committee assignment data.
2.2 Committee Assignments
Dealing with committee assignments is somewhat tricky – members are assigned to multiple committees, and not always the same numbers of committees. They also move committees frequently. If you take a look at the sw_cmte dataframe, you’ll see that this data is at the member-committee level, meaning each observation is a member and their committee assignment. This is a common problem in data cleaning, since what we ultimately want is one observation (row) per member.
Fortunately, the tidyverse gives us some easy tools to make this transition. First, let’s do a little tidying to the sw_cmte data and then take a glimpse at the average number of committee assignments per member.
##  [1] "Congress"
##  [2] "Committee code"
##  [3] "ID #"
##  [4] "Name"
##  [5] "Maj/Min"
##  [6] "Rank Within Party Status"
##  [7] "Party"
##  [8] "Date of Assignment"
##  [9] "Date of Termination"
## [10] "Senior Party Member"
## [11] "Committee Seniority"
## [12] "Committee Period of Service"
## [13] "Committee status at end of this Congress"
## [14] "Committee continuity of assignment in next Congress"
## [15] "Appointment Citation"
## [16] "Committee Name"
## [17] "State"
## [18] "CD"
## [19] "State Name"
## [20] "Notes"
# let's subset to the needed columns while renaming
sw_cmte <- sw_cmte %>%
select(cong = Congress, icpsr = `ID #`,
cmte_code = `Committee code`,
cmte_name = `Committee Name`,
cmte_senior = `Committee Seniority`)Here I’ve used the function dplyr::select to simultaneously drop unneeded columns from the dataframe while renaming the ones I’m keeping. This is a very useful function and works similarly to dplyr::rename which does not drop columns. Now let’s do a little digging into these data:
# how many unique committees are there per Congress?
sw_cmte %>%
  group_by(cong) %>%
  summarize(total_cmtes = length(unique(cmte_code)))
## # A tibble: 14 x 2
## cong total_cmtes
## <dbl> <int>
## 1 103 28
## 2 104 26
## 3 105 25
## 4 106 25
## 5 107 26
## 6 108 26
## 7 109 26
## 8 110 28
## 9 111 27
## 10 112 27
## 11 113 27
## 12 114 27
## 13 115 23
## 14 NA 1# on average, how big are committees per congress?
sw_cmte %>%
group_by(cong, cmte_code) %>%
summarize(size = mean(length(unique(icpsr)))) %>% # get total size of each committee per congress
group_by(cong) %>%
summarize(avg_size = mean(size)) # get average per congress## # A tibble: 14 x 2
## cong avg_size
## <dbl> <dbl>
## 1 103 34.0
## 2 104 33.8
## 3 105 35.6
## 4 106 35.4
## 5 107 36.7
## 6 108 37.8
## 7 109 35.6
## 8 110 35.2
## 9 111 35.2
## 10 112 32.0
## 11 113 32.9
## 12 114 31.9
## 13 115 36.1
## 14 NA 1# on average, how many committees does a given member belong to?
sw_cmte %>%
group_by(icpsr, cong) %>%
summarize(total_cmtes = length(unique(cmte_code))) %>% # per member, how many committees do they belong to per congress
group_by(cong) %>%
summarize(avg_belong = mean(total_cmtes)) # average across members per congress## # A tibble: 14 x 2
## cong avg_belong
## <dbl> <dbl>
## 1 103 2.12
## 2 104 1.95
## 3 105 1.98
## 4 106 2.00
## 5 107 2.14
## 6 108 2.21
## 7 109 2.09
## 8 110 2.18
## 9 111 2.13
## 10 112 1.93
## 11 113 1.98
## 12 114 1.93
## 13 115 1.87
## 14 NA 1This technique – taking a dataframe you’re newly working with and using various group_by and summarize operations – is a fantastic way to get to know your data. It’s also useful for uncovering previously unknown problems, such as missingness.
If you’re not familiar with these two functions, I highly recommend going through their respective sections in the R for Data Science book. The basic idea, though, is that we take our dataframe, group by a quantity of interest, such as the Congress or year or member, and perform a function to that entire Congress, such as summarize.
From the results of this exploration, we see that there are roughly 26-27 unique committees per Congress in these data, and members belong to about 2 on average. Committee membership size does vary some, but hovers around 35.
Our next step is to turn this committee-member level data into a member-Congress panel, with one column per potential committee assignment. This not obvious how to do, and involves moving from a long format, which is the current setup, to a wide format. Additionally, I am going to create a column per assignment which takes the value of 0 or 1 in order to facilitate future work with these data. You might want to do this, for instance, if you plan on working with committee assignment fixed effects or “dummy” variables.
2.2.1 Committee fixed effects (dummy variables)
First, let’s limit our data to begin in 2000 with the 107th Congress.
Now we’ll take a look at how many unique committees there are: sw_cmte %>% distinct(cmte_name) %>% View
It turns out there are quite a few, nearly 80. However, some of these are short-lived select committees, and others are duplicates but with different cased-names (Appropriations and APPROPRIATIONS). Let’s drop some temporary committees, remove party leadership positions (e.g., Majority Leader), and unify committee names. First, we’re going to install the package snakecase to save us some complicated regular expression work.
## [1] "WaysAndMeans"sw_cmte <- sw_cmte %>%
ungroup %>% # removes previous grouping structure
mutate(cmte_name = str_to_upper(cmte_name)) %>% # uppercase
filter(str_detect(cmte_name, "LEADER|WHIP|SPEAKER")==F) %>% # get rid of leader and whip positions
mutate(cmte_name = ifelse(cmte_name == "INTELLIGENCE (SELECT)", "INTELLIGENCE", cmte_name)) %>% # rename the intelligence cmte
filter(str_detect(cmte_name, "SELECT")==F) %>% # remove all other select committees
mutate(cmte_name = to_upper_camel_case(cmte_name)) # fix cmte namesWhat’s going on in this code?
First, I remove the prior grouping structure with ungroup, a good practice to get in. Next, I mutate the cmte_name variable to uppercase. Then I filter out leadership, whip and speaker positions and rename the intelligence committee since we want to keep that one (it is not temporary as other select committees are). Finally I drop the remaining select committees before mutating the cmte_name variable one last time. These functions are all very useful and will be used a lot moving forward. The R for Data Science book covers some other uses of them, but you’ll get a good sense of how to apply them in this guide.
We’re now down to only 36 distinct committees – much more manageable: sw_cmte %>% distinct(cmte_name) %>% View
Long to wide
Now for the slightly trickier part: converting our long dataset to a wide dataset, with one row per member per Congress. First, a little more preperation.
Since converting to a wide dataset will entail one column for each of the 36 distinct committees, I want to do something with the cmte_senior variable, which captures how senior the member is within that committee. This is a useful variable for a variety of reasons, but I only want one quantity of this per member-Congress. This is a subjective choice on my part which would have to be defended on substantive terms. In this case, I am going to keep the highest value of this variable per member-Congress. The idea here might be that this is a measure of overall seniority of the member.
A final step of cleaning: dropping duplicates member-congress-committee membership combinations and creating a variable member set to 1 (which will become useful shortly).
sw_cmte$member <- 1

sw_cmte <- sw_cmte %>%
  group_by(icpsr, cong, cmte_name) %>%
  filter(row_number()==1)
This code performs a useful trick of finding duplicates and then dropping them using the row_number function. The logic is there should only be one distinct observation per member-congress-committee; any duplicates are in error. You should always think carefully before dropping duplicates as it may indicate some other underlying problem in your data. I should note, there other ways to do this using these functions but I always liked this way because it is intuitive.
Let’s try the pivot to wide first without getting a unique seniority variable, using the pivot_wider function (instead of assigning this to an object, I like to pipe it into the View function):
sw_cmte %>%
  select(icpsr, cong, cmte_name, cmte_senior, member) %>%
  pivot_wider(names_from = cmte_name,
              values_from = c(member, cmte_senior),
              values_fill=list(member=0)) %>%
  View
What we see here is now close to what we want: a wide data frame with the observation (row) at the member-congress level. As you’ll see, there are now variables beginning with the prefixes member_ and cmte_senior_ which take the values they were assigned.
What’s going on here? The pivot_wider function needs two things: 1) names_from and 2) values_from. The logic is straightforward – we want to get the names of our newly created columns from our cmte_name variable, and the values for these columns frmo both the member and cmte_senior variables. We’re also going to use values_fill to fill in NAs in the member column with 0. This gives us a dataframe with 74 columns (variables) – but the cmte_senior_ columns are sparsely filled and not very useful. I’m going to create the max version of this variable and not include it in the pivot.
There is now only one unique value of cmte_senior per member per congress – the highest value. We can now do a more effective pivot_wider:
sw_cmte.wide <- sw_cmte %>%
  select(icpsr, cong, cmte_name, cmte_senior, member) %>%
  pivot_wider(names_from = cmte_name, values_from = member, values_fill=list(member=0))
Excellent! This is a dataframe we can work with:
## # A tibble: 6 x 6
## # Groups:   icpsr, cong [6]
##   icpsr  cong cmte_senior Agriculture Appropriations NationalSecurity
##   <dbl> <dbl>       <dbl>       <dbl>          <dbl>            <dbl>
## 1 15093   107           9           1              0                0
## 2 29137   107           6           1              0                0
## 3 39308   107           5           1              0                0
## 4 29311   107           5           1              0                0
## 5 29364   107           5           1              0                0
## 6 29300   107           5           1              0                1
As you can see, we now have one observation per member (icpsr) per Congress (cong) with 1s and 0s telling us about their committee assignment. These variables are now ready to use as dummy variables in a regression. Next, we’ll combine this with other congressional data as we get closer to something workable.
2.3 Creating a unified dataset:
With our committee assignment data in hand, let’s now merge it into the Stewart and Woon membership data. This is very easy, as both datasets have the unique identifier icpsr ID. There’s just one step before we can join them:
Now we can join using left_join, the most common join in my experience. To illustrate how this works, see the gif below from the excellent Garrick Aden-Buie:
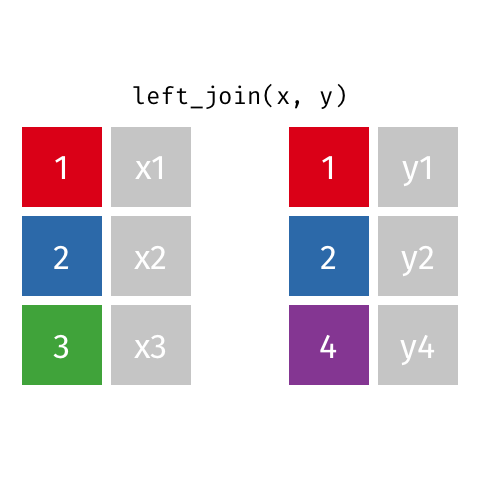
In this case, the colored column will be icpsr and cong and the extra rows in ‘y’ are the Congresses before the 107th, which we dropped from the committee assignment data.
## Joining, by = c("icpsr", "cong")That’s almost all there is to it. However, you’ll see that there are 3985 rows in the original sw_cmte.wide dataframe but 3988 rows in the resulting member_data dataframe. Why? This can only happen when there’s a duplicated ID combination in the right hand side of the join. We can do a little investigating to see what exactly caused this:
member_data %>%
  ungroup %>%
  group_by(icpsr, cong) %>%
  filter(n()>1) %>%
  select(icpsr, cong, name:Notes)
## # A tibble: 6 x 12
## # Groups: icpsr, cong [3]
## icpsr cong name district state_po state_ic party_txt party_num
## <dbl> <dbl> <chr> <dbl> <chr> <dbl> <chr> <dbl>
## 1 21320 113 Claw~ 19 FL 43 R 200
## 2 21320 113 Rade~ 19 FL 43 R 200
## 3 20910 115 Roon~ 17 FL 43 R 200
## 4 20910 115 Roon~ 19 FL 43 R 200
## 5 21523 115 Grav~ 6 LA 45 R 200
## 6 21523 115 Garr~ 5 VA 40 R 200
## # ... with 4 more variables: ch_senior <dbl>, `chamber period` <dbl>,
## # `chamber status` <dbl>, Notes <chr>It looks like there are some errors in the original data, as two members should not share the same ID. This sort of thing happens all the time and` is easily missed. Now for the glamorous side of data science, manually fixing coding errors. To do this, I’m going to download this CSV from VoteView and manually search for these members to figure out what’s going on. After searching, there are definitely some initial coding errors which we’ll fix manually. It’s important to keep this sort of thing in the code for replication and readability purposes.
sw_mems$icpsr[sw_mems$name == "Clawson, Curt"] <- 21377
sw_mems$icpsr[sw_mems$name == "Rooney III, Laurence F. (Francis)"] <- 21742
sw_mems$icpsr[sw_mems$name == "Garrett Jr., Thomas A."] <- 21721
Now we can run the join again:
## Joining, by = c("icpsr", "cong")And we get the right number of observations! More importantly, we have a full member of Congress panel dataset with committee assignments, chamber tenure, committee seniority, party, and district. This is a useful foundation on which to build, which we’ll do right now:
2.4 Adding in covariates
First, let’s add in some easy-to-use covariates from the cong_data we read in earlier. After that, we’ll create our full panel from different data sources.
To begin, I’ll select a few variables of interest and merge them into our member_data panel.
member_data <- cong_data %>%
  select(icpsr, cong = congNum, medianIncome, prcntBA, age, gender, chair, rank) %>%
  left_join(member_data, .)
## Joining, by = c("icpsr", "cong")Unfortunately, again, it looks like there were some duplicates on the right hand side, creating some additional rows. Let’s see what they are:
member_data %>%
  ungroup %>%
  group_by(icpsr, cong) %>%
  filter(n()>1) %>%
  select(icpsr, cong, name:Notes)
## # A tibble: 8 x 12
## # Groups: icpsr, cong [2]
## icpsr cong name district state_po state_ic party_txt party_num
## <dbl> <dbl> <chr> <dbl> <chr> <dbl> <chr> <dbl>
## 1 14828 108 Hall~ 4 TX 49 D 100
## 2 14828 108 Hall~ 4 TX 49 D 100
## 3 NA 112 <NA> NA <NA> NA <NA> NA
## 4 NA 112 <NA> NA <NA> NA <NA> NA
## 5 NA 112 <NA> NA <NA> NA <NA> NA
## 6 NA 112 <NA> NA <NA> NA <NA> NA
## 7 NA 112 <NA> NA <NA> NA <NA> NA
## 8 NA 112 <NA> NA <NA> NA <NA> NA
## # ... with 4 more variables: ch_senior <dbl>, `chamber period` <dbl>,
## # `chamber status` <dbl>, Notes <chr>Fortunately this is an easy one: it’s simply NA icpsr IDs and one duplicate for Ralph Hall’s ICPSR. We can easily fix both:
member_data <- member_data %>%
  filter(!is.na(icpsr)) %>%
  ungroup %>%
  group_by(icpsr, cong) %>%
  filter(row_number()==1)
Great. Another thing to note, though, is that the cong_data and Stewart and Woon data cover different time periods:
## [1] 103 104 105 106 107 108 109 110 111 112 113 NA 114 115## [1] 93 94 95 96 97 98 99 100 101 102 103 104 105 106 107 108 109
## [18] 110 111 112 113 NASo the cong_data stops in the 113th Congress. This is fine for our purposes, but it’s something to remember unless you want to create these measures from scratch (which we’ll do later!) – you have to work with what you have. Let’s drop observations after the 113th Congress.
3 Creating new measures
Our dataframe is almost set to work with. The last task is to create some new measures, in this example we’ll create our own measures of bill introductions using the Congressional Bills Project data. Go ahead and download the (large) zipped file of bills and resolutions from the 93rd to 114th Congress and extract to your data folder. We can now read this in:
## Parsed with column specification:
## cols(
##   .default = col_double(),
##   BillID = col_character(),
##   BillType = col_character(),
##   IntrDate = col_date(format = ""),
##   Title = col_character(),
##   Class = col_logical(),
##   DW1 = col_character(),
##   MemberID = col_character(),
##   NameFirst = col_character(),
##   NameFull = col_character(),
##   NameLast = col_character(),
##   Postal = col_character(),
##   URL = col_character(),
##   PLawDate = col_date(format = ""),
##   PLawNum = col_character(),
##   SubChRef = col_logical(),
##   SubRankRef = col_logical(),
##   Major = col_logical(),
##   Minor = col_logical()
## )
## See spec(...) for full column specifications.You’ll see some parsing failures as the read_delim function has a hard time automatically figuring out some of the column types, but this is not a big deal. We have to use the read_delim function here with the additional delim parameter because this is not actually a comma separated value file, it’s separated by semi-colons.
Now let’s do some additional data tidying:
Let’s do one further step: filtering down to only HR bills – bills introduced in the House that aren’t resolutions.
Great. Now let’s create some member-congress level measures of bill introductions using summarize:
cbp <- cbp %>%
  ungroup %>%
  group_by(icpsr, cong) %>%
  summarize(total_bills = length(unique(BillID)),
            total_imp_bills = length(unique(BillID[ImpBill==1])),
            total_pass_house = length(unique(BillID[PassH==1])),
            total_law = length(unique(BillID[PLaw==1])))
The logic behind this code is straightforward: first, we group the bills data by member and Congress in order to get a member-Congress panel, similar to above. Next, we perform a few summarize actions. The idea is we want to know how many bills per member per Congress are a) introduced, b) are important bills, c) pass the house, and d) are signed into law.
The length(unique()) operator is a useful trick for doing this. To create the total_bills variable all we want to know is how many bills were introduced, so how many unique bill IDs are associated with that member. We can then subset that count based on passing it simple conditions, such as through length(unique(BillID[ImpBill==1])) which simply says how many unique bills are associated with that member that are also marked as important. That’s all there is to it!
Let’s join this back into our member_data dataframe and we’re almost done:
## Joining, by = c("icpsr", "cong")One final step: since not all members introduce bills every Congress, there may be some NAs that should really be 0s. This is an easy fix, but make sure you really want to be replacing NAs with 0s, this is not always the proper thing to do.
member_data <- member_data %>%
  ungroup %>%
  mutate_at(vars(total_bills:total_law), ~replace_na(., 0))
This is a useful piece of code when cleaning data. The mutate_at function takes the vars() argument, the variables you want to manipulate. We then tell it what to do with those variables, in this case replace_na(., 0) where the . represents the current value of the variable.
And we’re done!
I’m going to save this dataset in case I want to use it later:
4 Next steps
You now know how to clean and merge files together using unique IDs, as well as how to fix some common problems along the way. You’ve also seen how to take other data out there, perhaps not in the format you want (a different unit of observation, maybe), and get it into workable formats for analysis.
I’ll return to a version of this data later on for running models and doing visualization. This dataset closely resembles some of those I use in my own work: it’s set up, for instance, to regress bill introductions on district characteristics (median income), committee assignments, chamber seniority, or other theoretically interesting sets of analyses.
Next I’m going to cover a slightly more complicated task: merging together datasets that do not share IDs and creating new measures from publicly available data on the internet.